AI Trading Bot Case Study: Following TensorParadigm’s Live Trades
Every TensorParadigm live trade from 6 to 25 October 2026: 78 closed trades, all profitable, and 10 still open below entry. Full record, fees, leverage and three worked examples.
TensorParadigm posts its agents’ entries and closes free in a public Telegram channel. At a snapshot on 26 October 2026, the channel held 88 trades. All 78 closed trades were profitable after commission. The other 10 were still open, and every one was below its entry price, by 0.7% to 11.1% before leverage. A 100% win rate on closed trades is therefore not the whole record: the open trades hold the current losses. This case study lists every trade and works through three of them to show how to check fees and leverage.
Full record at 26 October 2026, with three worked examples; not an exchange account statement
Open the public Telegram channel ↗KEY DISTINCTIONS
- Follow an entry and its closing message using the same trade ID, rather than looking only at a final profit screenshot.
- The stated commission is 0.12% on entry and 0.12% on exit. TensorParadigm confirms that the stated 0.03% slippage is already reflected in the posted prices.
- A return expressed against leveraged margin and a return expressed against opening position value use different denominators.
- Snapshot of 26 October 2026: 88 trades, 78 closed and all profitable, 10 still open and all below entry. Open trades are part of the record.
- The calculations below concern individual trades. Account growth, funding costs and drawdown require additional account and cash-flow records.
Why publish AI trading agent trades on Telegram?
A trading system is easier to understand when readers can follow a position while the sequence develops. TensorParadigm publishes entry and closing messages at t.me/tensorparadigm so people can observe the process without paying for access to the channel. The purpose is to show how the agents operate and how their reported outcomes are calculated.
For each example in this article, the exported metadata shows an entry post before the corresponding closing post. Readers can open both messages, compare the trade identifier and inspect the prices and times. This gives a more informative sequence than a screenshot showing only the final result.
TensorParadigm confirms that these records describe live trades executed by its agents and that the prices are average exchange fills. This article checks the published records and their arithmetic; it does not reconstruct an exchange account statement. A Telegram export preserves the version of each message available when exported, including edit metadata where present.
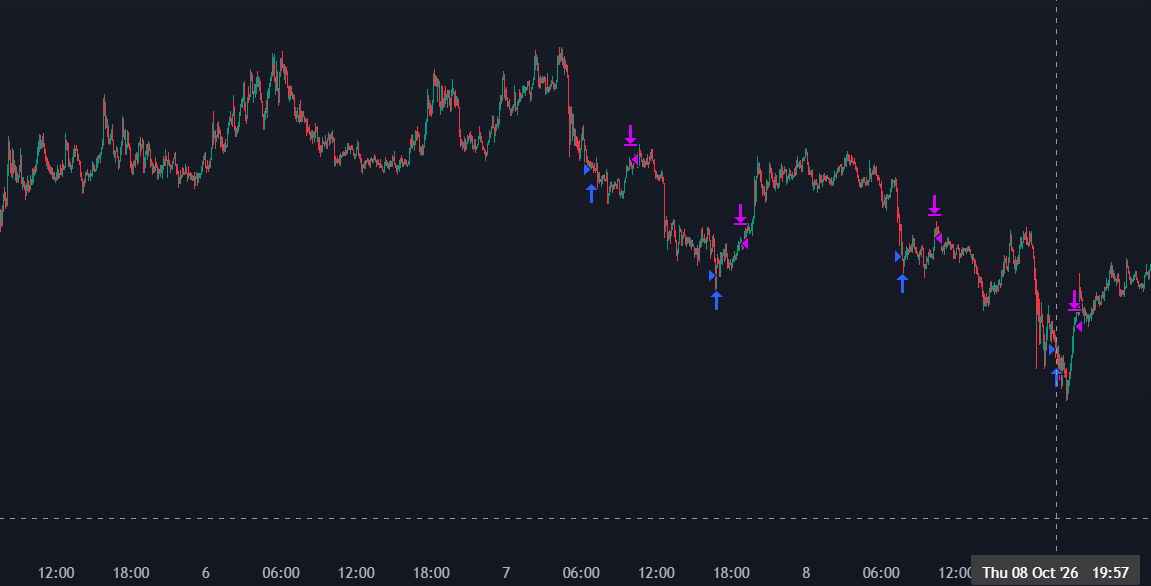
The full record: 88 trades, 10 still open
This table counts every trade posted in the channel, from the first entry on 6 October to the latest close on 25 October 2026, checked at 23:43 UTC on 26 October. It includes one NEAR trade that closed on 2 October, before the channel began posting entries. The CSV download lists each trade with its message links.
Every closed trade was profitable after commission. Before leverage, the median closed result was +1.19%, with a range of +0.06% to +4.88%. Closing posts showed 3× leverage on 46 trades, 10× on 28 and no multiplier on 4, which is why the posted percentages are larger.
The 10 open trades are where the losses sit. All of them were below their entry prices at the snapshot. The largest, HYPE at −11.1% before leverage, is about nine times the median closed gain. Many small closed gains alongside a few larger open losses is the pattern our win-rate guide warns about, so the result over time depends on how these open trades end.
| Measure | Value |
|---|---|
| Trades posted | 88 |
| Closed trades | 78 |
| Closed in profit / at a loss | 78 / 0 |
| Median closed result before leverage | +1.19% |
| Median posted closed result, with leverage | +4.75% |
| Median holding time, closed trades | 2.8 hours |
| Still open | 10 |
| Open trades below entry price | 10 of 10, −0.7% to −11.1% before leverage |
The 10 trades still open
Each row links to the entry post. The snapshot price is the Binance USDT-M futures last price at 23:43 UTC on 26 October 2026. Entry posts do not state leverage, so the change is shown before leverage. With leverage the loss on margin is larger: a 5% fall is about a 15% loss at 3×.
These are open positions, not closed losses. Their final results will appear in the channel when they close.
| Market / entry post | Profile | Entry time (UTC) | Entry price (USDT) | Snapshot price (USDT) | Change before leverage |
|---|---|---|---|---|---|
| HYPEUSDT · #47 | Balanced | 2026-10-07 16:40 | 88.131 | 78.351 | −11.1% |
| AAVEUSDT · #168 | Extra Aggressive | 2026-10-22 02:35 | 150.33 | 135.72 | −9.7% |
| ADAUSDT · #171 | Safe | 2026-10-22 08:10 | 0.2158 | 0.2063 | −4.4% |
| XRPUSDT · #181 | Safe | 2026-10-22 16:50 | 1.3118 | 1.3025 | −0.7% |
| 1000PEPEUSDT · #190 | Aggressive | 2026-10-23 21:30 | 0.0046390 | 0.0043085 | −7.1% |
| DOTUSDT · #192 | Safe | 2026-10-23 22:50 | 1.0798 | 1.0098 | −6.5% |
| DOTUSDT · #193 | Aggressive | 2026-10-23 23:10 | 1.0689 | 1.0098 | −5.5% |
| 1000PEPEUSDT · #194 | Balanced | 2026-10-23 23:45 | 0.0045271 | 0.0043085 | −4.8% |
| 1000PEPEUSDT · #195 | Aggressive | 2026-10-24 01:40 | 0.0045241 | 0.0043085 | −4.8% |
| DOTUSDT · #197 | Balanced | 2026-10-24 09:05 | 1.0556 | 1.0098 | −4.3% |
How the three worked examples were chosen
The walkthroughs below come from the first week of entries. We chose the first complete 10× QNT trade, the lower-return of two 3× EDEN trades that shared an entry, and a NEAR trade whose close shows no leverage, to cover three reporting formats.
All three were profitable, as every closed trade has been so far. They show how to check fees and leverage on a posted result. They do not show how a losing trade looks, and they are not a sample of the open positions above.
Example 1: a QNT trade from entry to closing record
Message #33 identifies QNTUSDT on the 1-minute timeframe, with the profile name Ultra Aggressive. It records a long entry at 253.72 USDT and an event time of 6 October 2026, 07:17 UTC. The entry message was posted at 07:18:02 UTC. The trade identifier is QNTUSDT-1m-4871820-20261006-0717.
Message #34 uses that same identifier and records an exit at 256.84 USDT at 09:08 UTC. It was posted at 09:09:04 UTC and reports +9.88% with 10× leverage. The event times are 111 minutes apart, agreeing with the displayed holding time of 1.85 hours.
The posting times describe channel publication, not exchange execution latency. The one-minute timeframe describes the strategy’s chart interval, while 111 minutes describes the holding period; these are different measurements. The profile name is a configuration label, rather than an independently measured risk rating.
| Event | Event time (UTC) | Post time (UTC) | Price (USDT) |
|---|---|---|---|
| Entry | 2026-10-06 07:17 | 2026-10-06 07:18:02 | 253.72 |
| Close | 2026-10-06 09:08 | 2026-10-06 09:09:04 | 256.84 |
How to check the return after entry and exit commission
For a long position with a constant quantity, let E be the average entry price and X the average exit price. The price return against opening position value is 100 × (X / E − 1). At the stated 0.12% commission on each side, the commission expressed against that same opening value is 0.12 × (1 + X / E). Thus the fee-adjusted price return is 100 × (X / E − 1) − 0.12 × (1 + X / E).
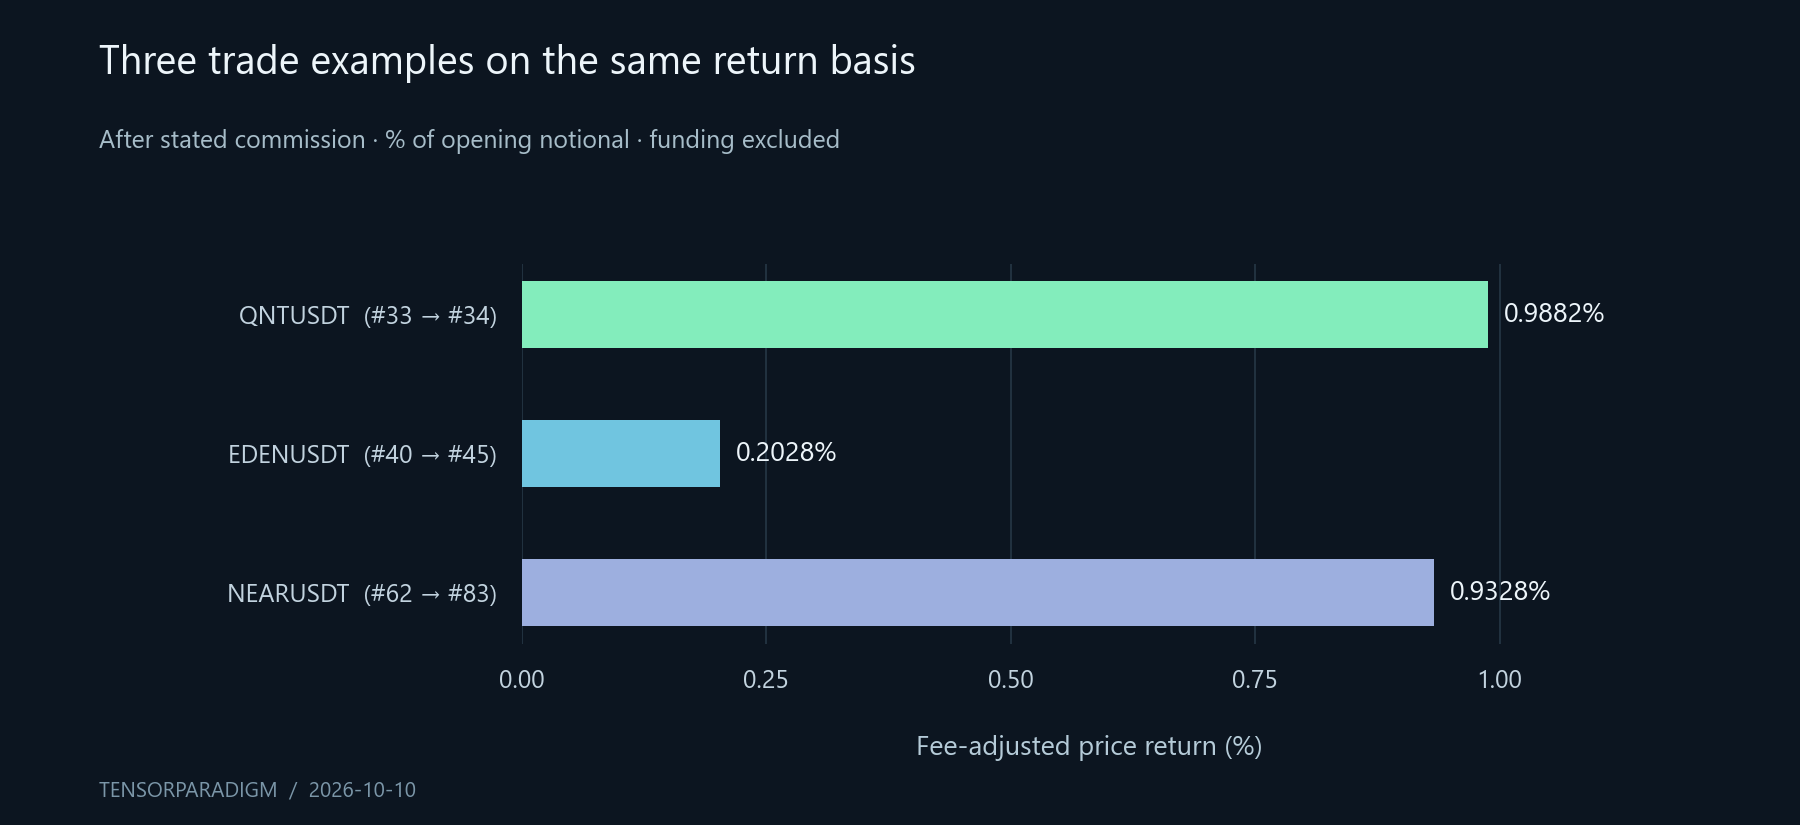
Using the QNT prices gives approximately 1.2297% before commission and 0.2415 percentage points of commission, leaving 0.9882% against opening position value. Multiplying that result by 10 gives approximately 9.8823%, which rounds to the posted 9.88%. The exit commission is slightly larger than the entry commission because this long position closes at a higher notional value.
The 0.12% rate is the rate supplied for this case study, rather than a claim about every Binance account’s current fee tier. Binance describes commission as transaction notional multiplied by the applicable rate. 2 The source posts display rounded prices, so recalculations are approximate; the selected records reconcile within the displayed precision.
Where does the 0.03% slippage go?
TensorParadigm confirms that the stated 0.03% slippage is already reflected in the posted average entry and exit prices. We therefore use those prices and deduct commission once. Subtracting a further 0.03% or 0.06% from these same returns would introduce a second slippage allowance into this calculation.
To measure realized slippage separately, one would also need the reference price at the decision or order-submission time and the actual weighted-average fill price. The Telegram price pair alone does not measure that difference. Slippage already embedded in fills and an additional hypothetical slippage stress test are different calculations.
Funding is a separate cash flow for perpetual futures. Its sign and amount depend on the position and settlement records. Binance distinguishes commission from funding. 2 The export does not include funding transactions, so the fee-adjusted calculations here exclude funding rather than assuming it is zero.
Comparing 3×, 10× and messages without a multiplier
A larger displayed percentage can reflect a smaller denominator. If a trade’s after-commission profit is divided by its opening notional value, it gives the normalized figure used here. If that same profit is divided by an initial margin equal to notional divided by L, the percentage is L times larger. That relationship assumes the same position, constant quantity and the stated margin basis.
For the selected QNT record, 9.88% divided by 10 is 0.988%. For the selected EDEN record, 0.61% divided by 3 is about 0.2033%. Both agree approximately with the calculation from their entry and exit prices. We retain the original figures alongside the normalized calculation, so the original reporting context remains visible.
The NEAR closing message reports +0.93% without a leverage label. Its price-based calculation is about 0.9328%. We leave the posted percentage unchanged and do not invent a leverage setting. Removing a multiplier for comparison also does not recreate an unleveraged trading history: different capital constraints, sizing and liquidation conditions could change which trades an account could execute.
| Trade / messages | Entry → exit (USDT) | Posted return | Multiplier label | Fee-adjusted price return |
|---|---|---|---|---|
| QNTUSDT · #33 → #34 | 253.72 → 256.84 | +9.88% | 10× | 0.9882% |
| EDENUSDT · #40 → #45 | 0.05865 → 0.05891 | +0.61% | 3× | 0.2028% |
| NEARUSDT · #62 → #83 | 4.684 → 4.739 | +0.93% | Not stated | 0.9328% |
What happened to the trades open at the first snapshot
The first version of this case study, dated 10 October, found three entries without a close: HYPE, XRP and LTC. We kept them in the record rather than dropping them.
XRP closed on 11 October at +0.97% with 3× leverage, and LTC on 12 October at +0.56% with 3×. HYPE was still open on 26 October, 11.1% below its entry price before leverage.
Treating an open position as a zero-return trade would hide information. So would removing it because it takes longer to finish. Open trades stay in the record until they close.
What these examples tell us about an AI trading bot
The three walkthroughs demonstrate a traceable link between an entry record and a closing record, different holding periods, and a reproducible treatment of commission and percentage denominators. They do not reveal every internal input that caused the agent to enter or exit. We therefore do not invent an explanation involving news, an LLM, a stop-loss trigger or a particular model signal when the message does not record it.
The export also does not supply position quantities, starting account equity, deposits, withdrawals, funding payments or a continuous valuation of open exposure. Without those records, adding trade percentages does not produce a portfolio return, and a line made from closed-trade percentages does not produce an account drawdown curve.
Multiple configurations can enter the same market at the same time. Their outcomes may be related, so separate trade IDs are not automatically independent statistical observations. Three weeks of trades help explain how the agents operate; longer observation across changing conditions is needed to judge whether results persist.
How to follow TensorParadigm’s live trade records
Open the public channel at t.me/tensorparadigm. Start with an entry post and retain its complete trade ID. When a close appears, match that identifier rather than only the symbol: one market can have several profiles or overlapping trades. Read the event time, posted price and leverage label together.
The full-record CSV lists all 88 trades with message links, prices, times, posted results and results before leverage, plus the snapshot price for each open trade. Any row can be checked against the channel.
For later updates, keep the original snapshot and add new observations with a new cutoff. Track existing unresolved IDs through to closure alongside new entries. Keeping the scope stable makes comparisons easier to understand and preserves trades that remain open longer.
Download all 88 trades (CSV) ↗
Method: constant-quantity long positions; supplied 0.12% commission per side; price-embedded slippage; funding excluded.
Frequently asked questions
Are these live trades or backtest examples?
TensorParadigm confirms that the selected records describe live agent-executed trades and that the posted prices are average exchange fills. This case study analyzes the exported channel records and calculations. The export is not an independent exchange account audit.
Are commission and slippage included?
The calculation uses 0.12% commission on each side. TensorParadigm confirms that the stated 0.03% slippage is already in the posted entry and exit prices, so it is not deducted again. Funding is outside this calculation because no funding transaction records were supplied.
Can a 10× return simply be divided by 10?
That produces a useful comparison when the displayed percentage equals the same after-commission trade profit divided by initial margin equal to opening notional divided by 10. The selected example reconciles on that basis. It is not a universal conversion for every exchange ROI field or a reconstruction of account performance.
Why does this article use three examples?
They illustrate explicit 10× reporting, explicit 3× reporting and a close without a leverage label. The full record of all 88 trades, including the 10 open ones, is in the tables above and in the CSV download.
Does this record show a 100% win rate?
Only for closed trades. All 78 closed trades were profitable, but all 10 open trades were below entry at the snapshot. Counting only closed trades would hide those losses, so they stay in the record until they close.
Can I view the channel without paying?
TensorParadigm makes this channel available free of charge so readers can observe entry and exit posts. Following the channel gives access to published records; it does not establish that every reader would receive the same fills or account results.
Sources
The trade figures come from the public Telegram channel, checked at 23:43 UTC on 26 October 2026. Open-trade snapshot prices are Binance USDT-M futures last prices at that time. The fee rate, fill-price provenance and embedded-slippage treatment were confirmed by TensorParadigm on 10 October 2026. Exchange documentation supports the general calculation method, rather than authenticating these particular fills.
- TensorParadigm public Telegram channel (checked 26 October 2026)
- Binance: futures commission and funding fees
Educational research, not personalized investment advice. Historical trade results do not guarantee future outcomes.