How Much Capital Do You Need to Run a Trading Bot? Fees, Position Sizing and Break-Even Returns
Can you start a trading bot with $100? Reproduce cost-inclusive sizing, entry and exit minimums, fixed-cost break-even and the difference between testing and income.
You do not need tens of thousands of dollars merely to build, paper trade or run a limited small-position bot. Some eligible markets support much smaller orders. A $100 account passes the disclosed single-position checks in our example, but a separate assumed $15 monthly bill overwhelms its trading contribution. The useful minimum comes from valid entry and exit sizes, affordable losses, total commitments and costs. Producing a meaningful cash income is a separate and much more demanding question. Additional capital cannot repair a negative trading edge after variable costs.
WHAT YOU CAN CALCULATE
- Size a $100, $500, $2,000 or $10,000 account without confusing the trade value with the planned loss.
- Check quantity increments and both entry and exit notional constraints instead of rounding a risk violation upward.
- Calculate when fixed costs are covered and recognize when no positive break-even balance exists.
- See how an income target changes the required arithmetic without assuming the return is attainable.
- Use current account rules, including the 2026–2027 US intraday-margin transition, rather than a universal $25,000 myth.
You can begin before you have a large trading account
A trading bot is software that makes and manages trading decisions. Its code does not require a five-figure brokerage balance. The capital question begins when the software must place real orders, survive their losses and pay its operating bills. A useful answer separates four jobs: researching a strategy, testing the order path, operating it economically and drawing an income.
| Goal | What must be funded or verified |
|---|---|
| Research and paper trading | Computing/data needs; no real-money position is required |
| A limited live execution test | Valid orders, available cash, affordable losses and reliable reconciliation |
| An economically viable bot | An evidenced edge after variable costs, plus sufficient scale to cover fixed costs |
| A cash-income objective | A much larger and uncertain return requirement, loss reserves and a withdrawal plan |
Research and simulated execution can begin without a live trading deposit. Alpaca’s paper-only API account, for example, uses simulated balances. Its documentation also explains what paper execution omits, including market impact and queue position. Computing, data and subscriptions may still cost money; a simulated fill supplies no evidence that a live order would receive the same execution. [1]
To check the calculations in this article, save the Python calculator, tests and assumptions in one folder. The complete results and instructions are readable directly. Run the commands below with Python 3.10 or newer. The calculator uses the standard library, makes no network calls and needs no trading credentials.
python capital_calculator.py
python -m unittest -v
One expected result is deliberately modest: in the stated $100 account, the sizing rule accepts 0.43 units at a reference price of $50, giving $21.50 of position notional and $0.4945 of modeled stopped loss. A separate monthly cost model loses $14.50 after an assumed $15 fixed charge. Passing an order-size check and covering a software bill are different accomplishments.
An order minimum gives you permission to trade a size
A concrete counterexample to a universal large minimum comes from Alpaca’s fractional-trading API: its documentation permits purchases from $1 in eligible US equities. Eligibility is symbol-specific and live account access depends on approval, product and country. That $1 is an eligible order amount. It does not establish the total balance a particular bot needs, and it is not a recommendation to use that broker. [2]
Crypto venues have their own constraints. Binance documents separate price increments, quantity increments and minimum-notional filters. Kraken distinguishes deposit minimums from trade minimums, with base-asset quantities affecting the latter. A deposit can succeed while an order fails. Consumer “buy crypto” screens and order-book APIs can also have different rules and fees. Retrieve current metadata for the exact account, symbol and order type. Documentation examples are not live specifications. [3] [4]
The familiar $25,000 figure also needs a dated, jurisdiction-specific explanation. FINRA adopted new US securities intraday-margin standards effective 4 June 2026, replacing the old pattern-day-trader framework and its $25,000 minimum. Firms have a permitted implementation transition through 20 October 2027. The SEC explicitly says a broker may continue using the old requirements during that transition. As of this article’s 22 October 2026 review, ask which framework your broker actually implements. Ordinary margin and house requirements still apply. These US securities rules are not a worldwide minimum for trading bots or crypto spot accounts. [7] [8]
Size the position from a cash-loss budget, including costs
Our sizing exercise uses one fully funded long spot position, denominated in USD, with no borrowing. The assumptions below are invented for transparent arithmetic. The fees are not quotes from Alpaca, Binance or Kraken; an actual entry-level tier may be substantially more expensive. USD and USDT are different assets, so a USDT implementation also needs its own conversion and custody assumptions.
| Input | Assumption |
|---|---|
| Account equity | 100 / 500 / 2,000 / 10,000 USD |
| Planned loss fraction r | 0.5% of current account equity; an illustration, not a recommendation |
| Stop distance d | 2% from reference entry price |
| Linear round-trip friction c | 0.3% of opening notional |
| Reference price | 50 USD per unit |
| Quantity increment | 0.01 units; this is not a price tick |
| Minimum entry notional | 10 USD |
| Entry cash reserve | Notional × 1.0005 adverse-price factor × 1.001 fee factor |
Let E be account equity, r the chosen fraction of equity allocated to planned trade loss, d the reference-price distance to a stop and c a linear round-trip friction allowance. The notional ceiling from the loss budget is E × r / (d + c). Our c combines 0.10% commission on each side with a 0.05% adverse-execution allowance on each side. The execution allowance represents spread and slippage together in this example; adding a separate spread charge would double count that allowance.
For $100, the planned budget is $0.50. Dividing by 2.3% gives $21.73913 of unrounded notional. At a $50 reference price, that is 0.4347826 units. Rounding downward to the 0.01 quantity increment gives 0.43 units: $21.50 notional and $0.4945 modeled loss. The calculator also reserves the entry cash, including the assumed adverse entry price and entry commission. Both the cash and risk ceilings must pass.
planned_cash_loss = account_equity × risk_fraction
risk_notional_ceiling = planned_cash_loss / (stop_fraction + round_trip_friction)
cash_notional_ceiling = available_cash / ((1 + entry_adverse_fraction) × (1 + entry_fee_fraction))
quantity = floor(min(risk_notional_ceiling, cash_notional_ceiling) / price / quantity_step) × quantity_step
modeled_stopped_loss = quantity × price × (stop_fraction + round_trip_friction)
The word planned matters. The SEC’s stock-order bulletin explains that a stop price does not guarantee the execution price; a stop-limit can remain unfilled. Crypto trigger and execution rules must be checked at the actual venue. Our linear allowance describes one assumed execution case. It places no maximum on a gap, failed exit, venue outage or larger loss. Changing the stop distance also changes the strategy and requires evaluation. [6]
What $100, $500, $2,000 and $10,000 support in this example
Every row below uses the same reference price, stop, cost allowance and risk fraction. The position occupies about 21.7% of equity before rounding. The rest of the balance remains cash in this single-position exercise. A $0.50 planned loss budget therefore does not mean a $0.50 trade, and a $100 account does not require deploying all $100.
| Equity, USD | Planned loss budget, USD | Rounded units | Notional, USD | Modeled stopped loss, USD |
|---|---|---|---|---|
| 100 | 0.50 | 0.43 | 21.50 | 0.4945 |
| 500 | 2.50 | 2.17 | 108.50 | 2.4955 |
| 2,000 | 10.00 | 8.69 | 434.50 | 9.9935 |
| 10,000 | 50.00 | 43.47 | 2,173.50 | 49.9905 |
All four rows clear the assumed entry minimum and the additional same-quantity exit check described next. That establishes arithmetic feasibility under the disclosed rules. It says nothing about whether the signals have predictive value, whether these prices are obtainable or whether this trade belongs in a particular person’s finances.
A small account can answer useful operational questions: did the signal arrive on time, was the order accepted, did fees match the ledger, and did the exit reconcile? Increasing the deposit cannot turn twenty observations into two thousand observations. Statistical evidence comes from the experimental design and the subsequent record. Smaller orders can also have different rounding and fill behavior from larger ones.
Why even a mathematically valid small entry can be too small to exit
The smallest permitted entry in our assumed quantity grid is 0.20 units, worth $10. Its modeled stopped loss is $0.23. A 0.5% risk budget needs $46 of equity to permit that entry; the required entry cash is smaller. At $45.99 the calculator skips the trade. It does not round upward to rescue an order that violates the budget.
Now impose the same assumed $10 notional minimum on the stopped exit. Selling those 0.20 units after a 2% reference-price decline and a further 0.05% adverse exit move produces $9.7951 of exit notional. The entry passes and this extra exit check fails. The next quantity step, 0.21 units, gives $10.50 entry notional and $10.284855 exit notional. Its modeled loss needs $48.30 of equity under the same 0.5% budget.
Neither $46 nor $48.30 is a suggested deposit. These are boundaries of specified arithmetic checks. A real venue may apply different filters to different exit types; fees paid in the base asset can reduce sellable quantity; partial fills and further price moves change the result. The calculator does not implement those venue rules. It demonstrates why both directions must be investigated. [3]
The implementation uses decimal arithmetic and checks the exact boundary. Rounding down protects the stated ceiling; rounding up can breach it. Changing price or quantity increments can raise the minimum executable size. If your actual bot cannot express a smaller risk-compatible order, keeping that signal in paper mode is a valid outcome.
Write a cost ledger before choosing a balance
Start with costs on executed notional: entry and exit commission, spread and execution shortfall. Add product-specific charges such as funding or margin financing where applicable. Keep one-off deposits, withdrawals and conversions separate from recurring hosting, software, data or AI subscriptions. Kraken’s official fee overview illustrates how charges depend on trading route and execution classification. A consumer fee waiver does not automatically waive order-book API fees. [5]
Use the actual account tier and record the fee currency. A limit instruction can cross the book and execute as a taker. If your input returns already include trading fees, avoid deducting those fees again. If your fills already incorporate spread and slippage, account for the execution shortfall once. A fee ledger should reconcile to fills and balances rather than to the price printed on a platform’s marketing page.
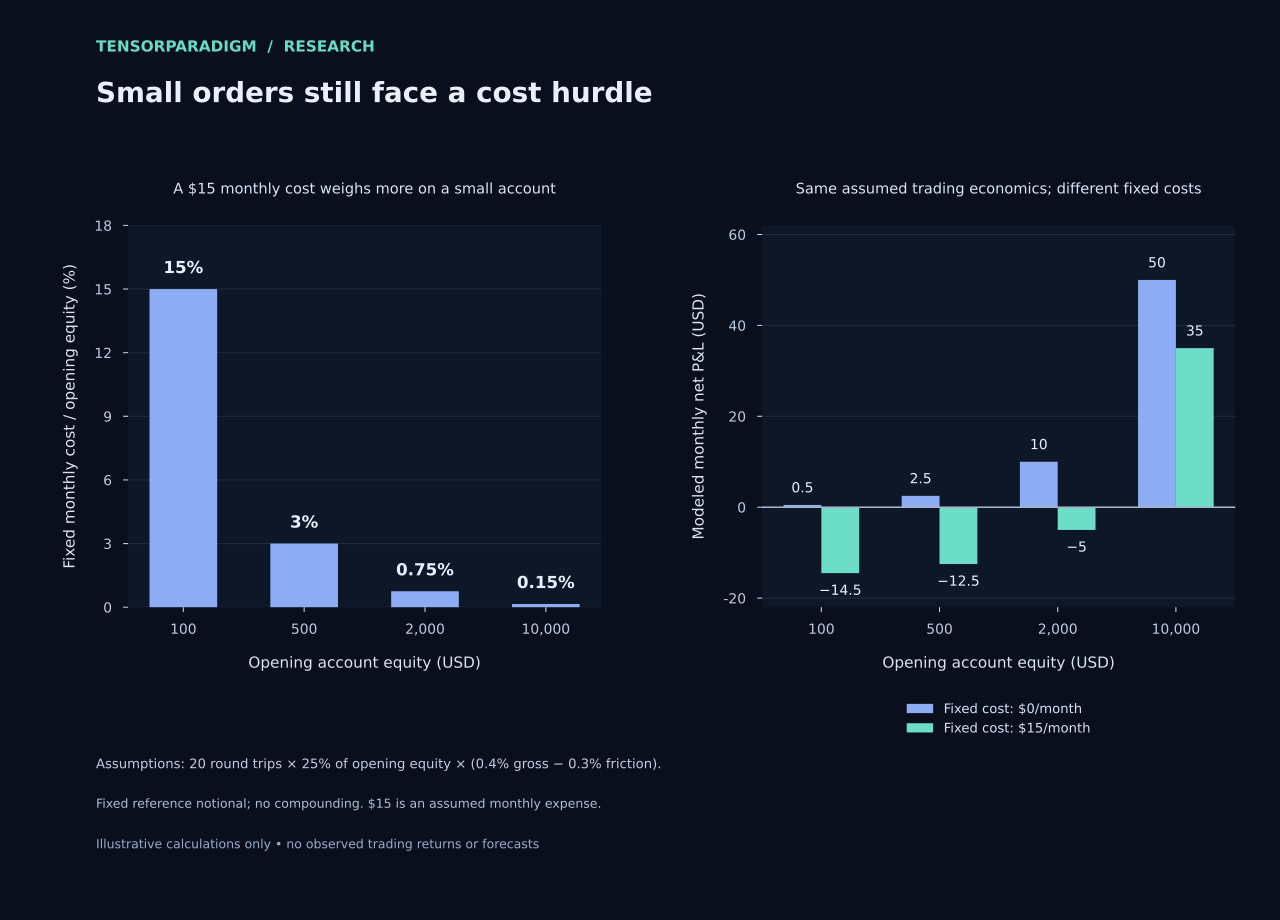
For a small account, the fixed bill is often the clearest hurdle. A hypothetical $15 monthly service charge consumes 15% of a $100 account, 3% of $500, 0.75% of $2,000 and 0.15% of $10,000 before any trading outcome. These are cost ratios, not required returns that a bot can reliably produce. The correct response may be a simpler setup with lower fixed costs.
A local scheduled script can have a different cash budget from a paid round-the-clock stack. Your time, electricity, reliability and data requirements still exist. Budget for what the strategy actually needs. A monthly server is not automatically necessary for every bar-close strategy, and saving on infrastructure is useful only if the resulting execution and monitoring remain adequate.
A break-even calculation answers when fixed costs are covered
Use a separate unit-economics model to isolate the effect of scale. Assume 20 completed round trips per month, each with opening notional equal to 25% of the month’s opening equity, an average gross return of 0.4% on that notional and 0.3% round-trip friction. Assume a fixed monthly bill of $15. None of those values was estimated from market data or a bot record. The positive average gross return is an assumption we must later substantiate.
The assumed result after variable costs is 20 × 0.25 × E × (0.004 − 0.003) = 0.005E. After the fixed bill it is 0.005E − 15. Setting that expression to zero gives $3,000. That is the break-even point of this assumed model, with zero remaining profit. With a zero fixed bill the model has no positive fixed-cost capital threshold; with a $50 bill its threshold becomes $10,000.
| Opening equity | After variable costs, before fixed bill | Fixed bill | Result after fixed bill |
|---|---|---|---|
| 100 | 0.50 | 15.00 | −14.50 |
| 500 | 2.50 | 15.00 | −12.50 |
| 2,000 | 10.00 | 15.00 | −5.00 |
| 10,000 | 50.00 | 15.00 | +35.00 |
monthly_result = completed_round_trips × deployed_fraction × opening_equity × (average_gross_notional_return - round_trip_friction) - fixed_monthly_cost
if average_gross_notional_return > round_trip_friction:
    break_even_equity = fixed_monthly_cost / (completed_round_trips × deployed_fraction × (average_gross_notional_return - round_trip_friction))
This model fixes each trade’s notional relative to opening-month equity. It does not compound a monthly path, require twenty winning trades, simulate a drawdown or reconstruct an order ledger. Its 25% allocation is separate from the roughly 21.7% sizing example. A real strategy must reconcile its actual sizes, costs, losses and skipped signals before either calculation can describe it.
Treat the fixed bill as a project expense. If it is paid outside the broker account, broker equity and total project profit differ. If it is taken from the trading account before sizing, available equity is lower. The table below is an economic result after the expense, with no claim about the timing of that cash payment. Do not subtract the same bill twice.
More capital cannot fix a negative trading edge
Before solving for a break-even balance, check the sign of the result after variable costs. If average gross return equals friction, the trades contribute zero and a positive fixed bill remains uncovered at every size. If gross return is below friction, scaling the same trades increases the modeled dollar loss. Capital reduces a fixed bill’s percentage burden; it does not reverse a negative percentage margin.
Keep the same assumed 0.4% average gross notional return and change only total round-trip friction. The table shows why a low cost estimate cannot be treated as a footnote. Underestimating execution or using an unavailable fee tier can change whether a break-even balance exists at all.
| Round-trip friction | Gross minus friction per trade | Fixed-cost break-even equity |
|---|---|---|
| 0.1% | +0.3% | 1,000 USD |
| 0.3% | +0.1% | 3,000 USD |
| 0.6% | −0.2% | No positive balance covers the bill in this model |
| 1.0% | −0.6% | No positive balance covers the bill in this model |
Trading more often also needs evidence. In this linear model, more identical positive-margin trades spread a fixed bill across more activity. In a real strategy, extra signals can have different expected returns, costs and exposures. A turnover target chosen to pay a subscription is not a reason to expect profitable new trades. Changing the signal frequency creates another strategy to evaluate.
The same caution applies to scale. At larger sizes, impact, liquidity, fees and infrastructure costs may change. The straight-line model is a sensitivity calculation over stated inputs, rather than evidence that a strategy can be multiplied indefinitely.
Starting a bot and replacing an income require different arithmetic
A $100 live experiment can be useful even when its financial output is measured in cents or dollars. If the objective becomes $1,000 a month, the denominator changes. At a hypothetical monthly account return of 1% after variable trading costs but before a $15 fixed bill, the arithmetic requires ($1,000 + $15) / 0.01 = $101,500. That answers a conditional equation. It does not establish that a 1% monthly return is available.
| Assumed monthly return after variable costs, before fixed bill | Equity required for $1,000 plus $15 fixed bill |
|---|---|
| 0.5% | 203,000 USD |
| 1.0% | 101,500 USD |
| 2.0% | 50,750 USD |
The table varies that assumed return. The three rates are neither a supported range nor sustainable targets. Each assumes a positive outcome for the month, ignores the path and leaves taxes outside the calculation. Negative months, changing opportunity, withdrawals and the reserve needed to keep operating remain unresolved. A real income plan needs those cash-flow questions answered.
Compare a proposed balance with the return it would need to generate. Extracting $1,000 from $100 in a month requires a 1,000% gain before any fixed bill. A bigger leverage setting changes exposure and the chance of losing the account; it supplies no evidence for that return. A small budget is a reason to scale the project’s objective, rather than turn an income target into a forecast.
Fund the complete strategy and its loss sequence
A single-entry example does not fund a grid or DCA sequence. Orders of $50, $75, $100 and $150 can commit $375 before fees or a reserve. If three positions can each expand through that sequence, the gross funding requirement can reach $1,125 before those additions. Model the states the software actually permits, including orders that have been accepted but have not filled.
Planned trade risk also accumulates through time. If each of 20 consecutive losses removes exactly 0.5% of then-current equity, the account retains (0.995)^20 = 90.46105% of its starting value. The drawdown is 9.53895%, and recovering to the start requires about 10.54482% on the remaining balance. This is deterministic loss-sequence arithmetic, with the stated percentage already representing the full loss; no extra fee deduction is added.
A fixed $0.50 loss on a shrinking $100 account behaves differently: after 20 such losses it retains $90, and the next $0.50 represents more than 0.5% of what remains. Neither calculation estimates the probability of a losing sequence. They show why sizing needs a defined equity base and why a one-trade budget is not an account survival guarantee.
Several bots need one shared budget. Uncommitted cash in one calculation cannot simultaneously be promised to every strategy. The multi-bot portfolio guide explains capital reservations and account-level controls. Set aside any operating expense or reserve before assigning capital to orders, and keep living expenses outside the bot’s experimental budget.
Leverage changes the exposure, not the evidence
The worked examples use fully funded positions. A derivative can permit larger notional with less initial collateral, while introducing maintenance margin, liquidation, financing or funding and contract-specific increments. Fees can apply to the larger notional. A small margin deposit therefore cannot be substituted for the full economics of the underlying exposure.
When the actual minimum position violates a loss budget, increasing leverage does not make that position smaller. Tightening a stop solely to fit the account can change the strategy’s behavior and execution risk. A defensible response is to use an eligible smaller instrument, change and reevaluate the design, or continue testing without live exposure.
The article’s account sizes, 0.5% risk fraction and cost assumptions are examples to inspect. They do not identify a safe leverage ratio or an appropriate deposit for every reader. In a real capital worksheet, preserve the product’s collateral rules and the account’s ability to reduce exposure during adverse conditions.
Use a worksheet that can return “do not place the order”
Begin with the exact instrument, account type, symbol filters, fee schedule and intended order route. Record available trading equity after any expenses already paid. Calculate the smallest valid quantity and the largest quantity consistent with both cash and planned loss. Check the rounded entry and the specified exit, then assess the whole sequence and overlapping positions. If no permitted quantity satisfies the rules, return a skipped trade with a reason.
Next separate variable trading economics from fixed project costs. Estimate the former from a properly timed backtest and subsequent records with actual execution assumptions; inspect the uncertainty rather than importing the positive return used in our sensitivity table. The Python and Pine Script comparison shows how execution conventions can change measured results. Update the capital calculation whenever the rules, pair, frequency, tier or service bill changes.
ChatGPT or Claude can help turn documented inputs into a worksheet. Codex or Claude Code can implement the decimal sizing, boundary tests and reconciliation. Ask for the records and units behind each result. AI assistance does not supply a trading edge or certify that a product is available in your jurisdiction. The supplied calculator was implemented with AI assistance and verified using executable arithmetic tests; no AI trading performance comparison was conducted.
Audit this proposed trading bot using my documented account equity, available cash, symbol quantity step, order minima, price reference, stop rule, fee currency, execution assumptions, full order sequence and fixed costs. Separate observed records from assumptions. Calculate cost-inclusive planned sizing with decimal arithmetic, round quantity downward, check the stated entry and exit, and skip infeasible trades with reasons. Reconcile simultaneous commitments. Show the sign of gross edge minus variable costs before calculating any fixed-cost break-even. Do not invent returns, recommend a deposit from an income target, or treat a stop as a guaranteed loss cap. Return the formulas, input sources and boundary tests.A useful first milestone is a working, affordable experiment
You can start learning, coding and testing without waiting to accumulate tens of thousands. A small live balance can also support a specific simple design when its complete order path, costs and planned losses fit. Our $100 example shows how that can happen under transparent assumptions. The practical next step is to check your own inputs and define what the experiment is meant to establish.
If costs dominate, reduce avoidable fixed charges or keep researching in paper mode. If a quantity is infeasible, skip it or evaluate a different design. If the trading margin after variable costs is negative, investigate the strategy rather than adding a larger deposit. When the objective becomes cash income, use conditional arithmetic to expose the required assumptions and account for losses and withdrawals separately.
The amount to begin is set by the job, the rules and the affordable loss. The amount worth scaling requires evidence of an edge and viable operation. Keeping those decisions separate gives a small account a useful role without promising it the earning capacity of a large one.
Ten checks before choosing the starting balance
- Define the goal: research, execution testing, viable operation or cash income.
- Verify country, account, product and current broker or venue requirements.
- Record actual price/quantity increments and entry and exit minima for the intended route.
- Use available equity after paid expenses and reserve committed cash across all orders.
- Include the actual fee currency and one consistent allowance for spread and execution shortfall.
- Size from the documented planned-loss rule, round down and skip infeasible quantities.
- Fund the full allowed DCA/grid sequence and all permitted concurrent positions.
- Check the sign of the strategy’s contribution after variable costs before solving for a fixed-cost balance.
- Separate economic project profit from broker cash flows and deduct each expense once.
- Retain uncertainty, adverse loss sequences and explicit conditions for any later increase in capital.
Practical questions about trading bot starting capital
Can I start a trading bot with $100?
A specific small-position bot may be feasible if its entries, exits, total commitments and costs fit the actual account rules and the loss is affordable. In our assumed USD example, $100 accepts 0.43 units, $21.50 notional and $0.4945 modeled stopped loss. The separate monthly model loses $14.50 after a $15 fixed bill. Those calculations distinguish a limited experiment from economically viable operation.
Do trading bots require $10,000 or $25,000?
There is no worldwide bot-capital threshold. Eligible fractional orders and some spot markets can be much smaller, while specific products and brokers can impose substantial requirements. FINRA’s US intraday-margin amendments took effect on 4 June 2026 with a transition through 20 October 2027; a firm may still operate under the old day-trading framework during that transition. Check the actual broker and account. [2] [7] [8]
Is a $1 or $10 minimum order enough to operate a bot?
It establishes only an order constraint. Fees, quantity steps, exits, further entries, concurrent commitments, cash and planned loss must also fit. Our $10 entry at $46 equity fails the extra assumed $10 stopped-exit test. Under those same disclosed assumptions, $48.30 accommodates the next quantity step and that exit check; neither number is a recommended deposit.
How much does a monthly bot subscription change the answer?
Divide the fixed charge by available trading capital, then separately evaluate the uncertain result after variable trading costs. A $15 monthly bill is 15% of $100 and 0.15% of $10,000. In our assumed positive-margin monthly model it is covered at $3,000, with zero remaining profit. A lower bill can reduce that hurdle; more capital cannot repair negative trading economics.
Does risking 0.5% mean I cannot lose more than 0.5%?
No. It is a sizing assumption for one modeled outcome. Stop execution can slip or fail, several positions can lose together and losses repeat over time. The SEC explains that stock stop prices do not guarantee execution prices; crypto venues have their own trigger and execution rules. Our calculator supplies no maximum possible loss or survival probability. [6]
How much capital would produce $1,000 a month?
No fixed amount can be inferred without assuming an uncertain net return. At a hypothetical 1% monthly account return after variable costs but before a $15 fixed bill, the conditional arithmetic is $101,500. At 0.5% it is $203,000; at 2% it is $50,750. These are sensitivities, not supported return targets or balances recommended for a salary plan. Losses, taxes and withdrawals require separate analysis.
Can ChatGPT, Claude, Codex or Claude Code build the capital calculator?
They can help implement documented arithmetic and audit an export. Give them exact units, fee currencies, quantity increments, account rules and a testable exit convention. Require boundary tests and a reason for each skipped order. None of those tools can infer a profitable edge from the deposit amount or turn assumed returns into evidence.
What should I do if my account is too small for the strategy?
Continue research or paper trading, reduce avoidable fixed costs, or evaluate a design with genuinely smaller permitted orders or fewer simultaneous commitments. Changing stop rules, frequency or the order ladder changes the strategy and needs another evaluation. Avoid automatically rounding up, increasing leverage or depositing more just to make the first order pass.
Methods, sources and reproducibility
This is a substantial update of our starting-capital guide, originally published on 24 September 2026. Provider and rule references were checked on 22 October 2026. The Python examples are deterministic TensorParadigm calculations from fully disclosed assumptions: no market data, fitted returns, executed trades or Monte Carlo experiment were used. The references document eligibility, execution constraints and rules; they do not endorse our examples or establish a profitable bot.
- Alpaca: Paper Trading API documentation and simulation limitations
- Alpaca: Fractional Trading API documentation and eligible $1 orders
- Binance: Spot API Filters—official source documentation
- Kraken: Overview of deposit and trade minimums
- Kraken: Overview of fees, trading routes and additional charges
- SEC Investor.gov: Stop, Stop-Limit, and Trailing Stop Orders—bulletin updated 18 August 2026
- FINRA Regulatory Notice 26-10: Intraday margin standards; effective 4 June 2026, transition through 20 October 2027
- SEC Investor.gov: Margin Rules for Day Trading—current transition notice
Educational capital and cost analysis. All numerical trading inputs and returns are assumptions, not a track record, return forecast, suitable deposit or guaranteed loss limit. Actual product access, fees, execution, taxes and account requirements must be verified for the intended setup.